1
Trace dashboard
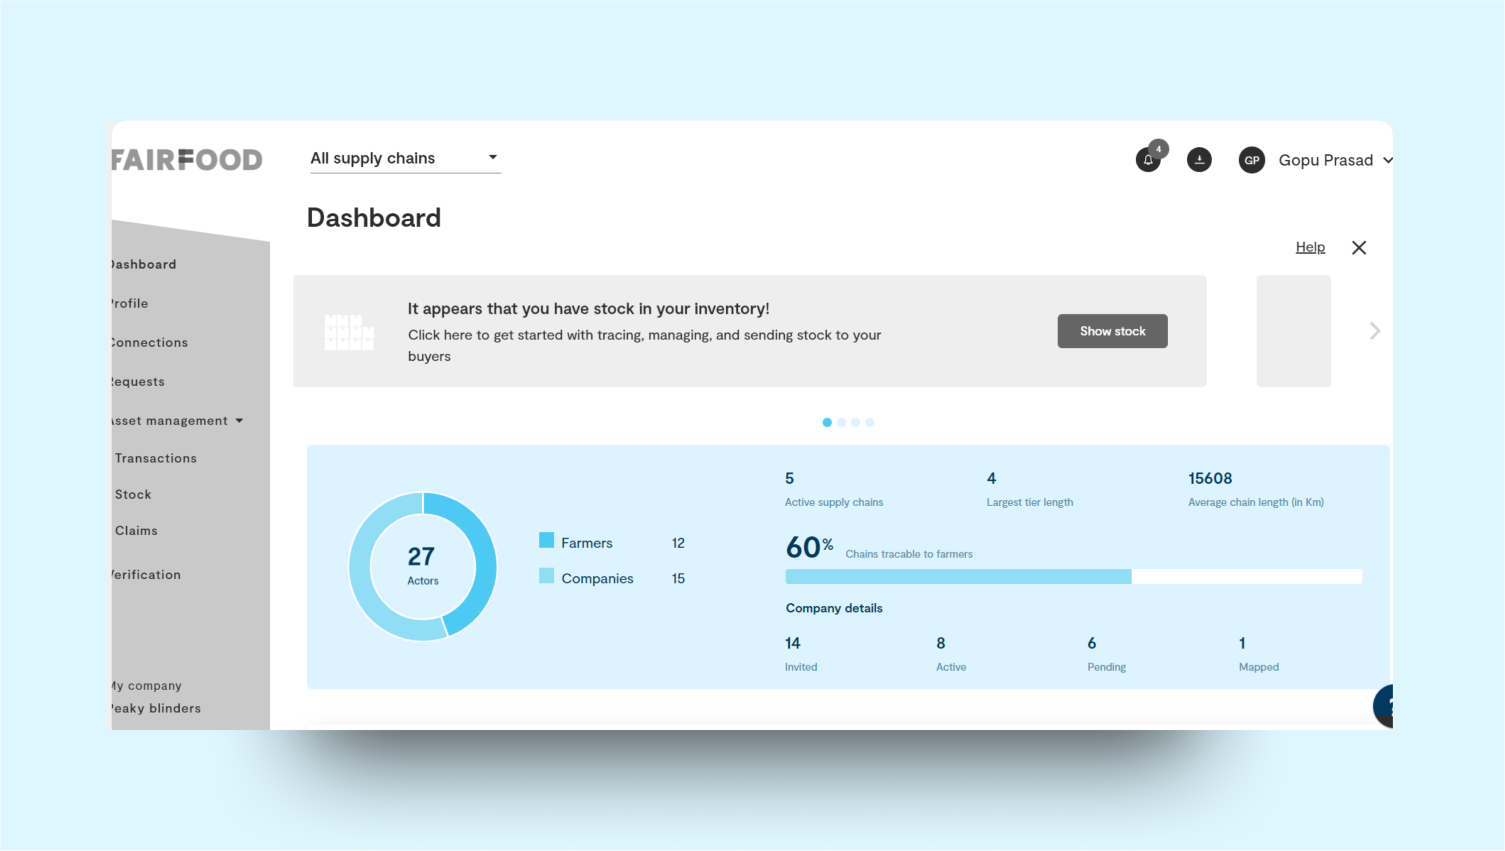
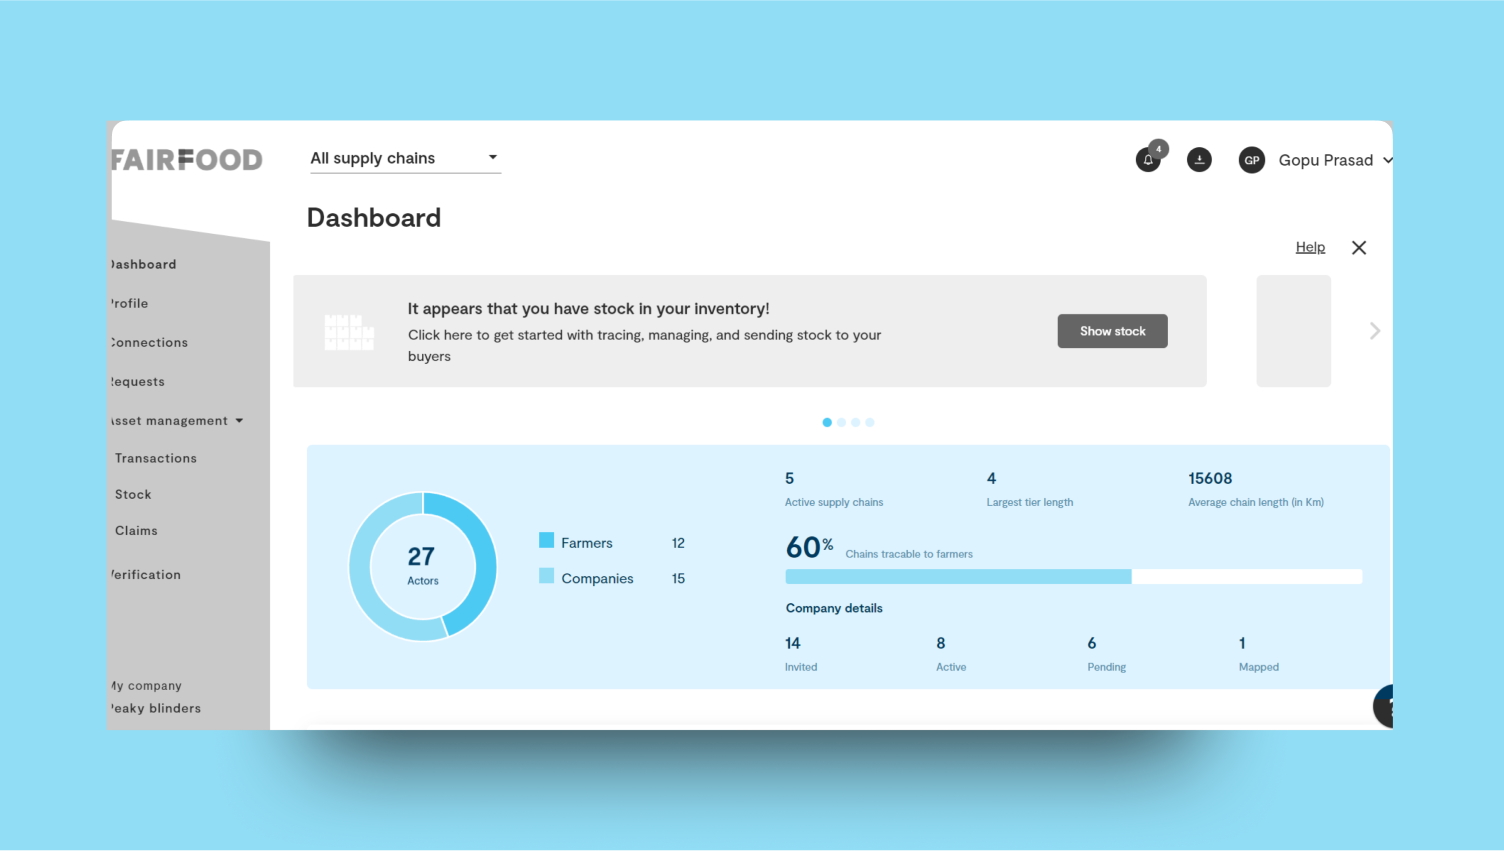
- At the top of the dashboard, you can see key numbers like the total count of farmers, companies, supply chains, and the length of the chain. This gives a quick summary of the entire system.
- A map is displayed below, showing the locations of farmers and suppliers. It also includes details and statistics related to these actors, making it easy to understand their role in the supply chain.
- Below the map, there is a section that provides details about products in stock and recent transactions. This helps you keep track of inventory and recent trade activities.
- At the bottom of the dashboard, you can find a list of recent activities and tasks that need attention. This ensures you stay updated on changes and can address any important actions promptly.
2
Connections overview
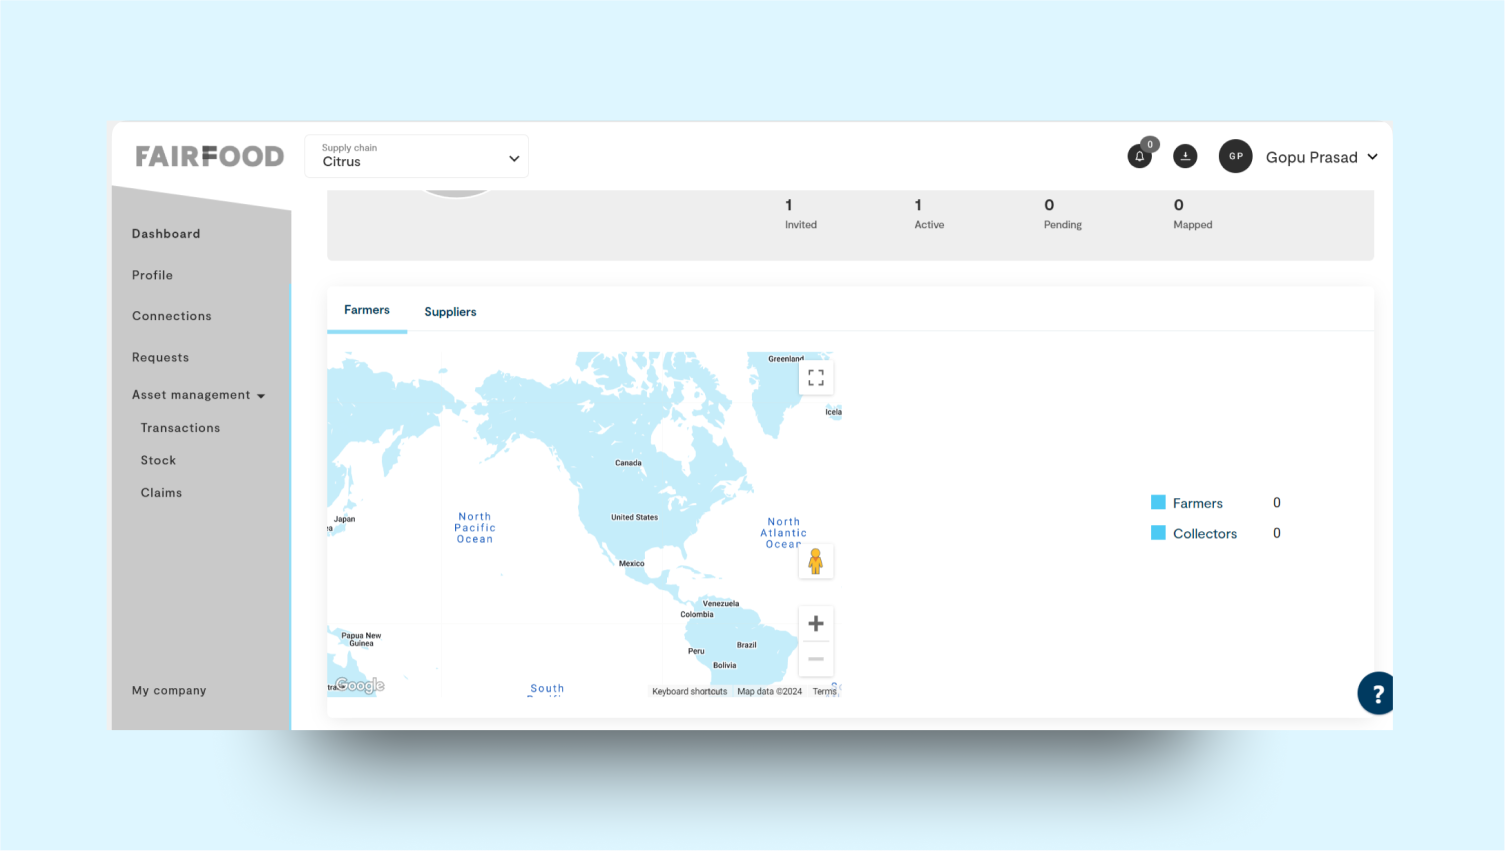
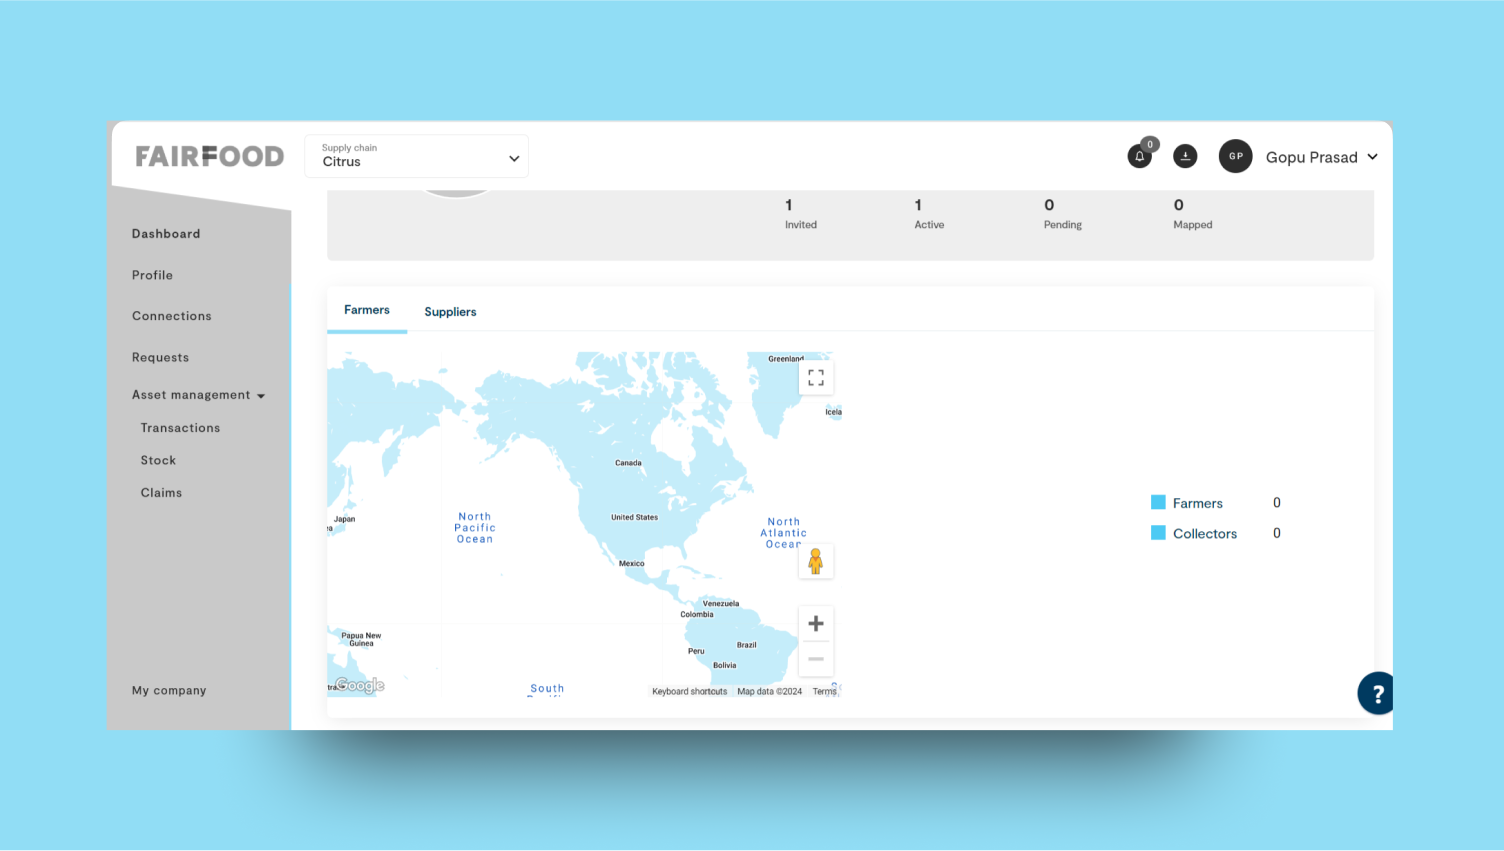
- The Connection Overview has two tabs: Farmers and Suppliers.
- In the Farmers tab, a map shows the connections as nodes in specific areas, representing farmers and their links within the supply chain.
- On the right side of the map, statistics are displayed for farmers and collectors, giving a summary of their numbers and activities.
- In the Suppliers tab, a similar map is shown, displaying suppliers distributed across different areas. This helps track where suppliers are located and their connections within the network.
3
Supply chain overview
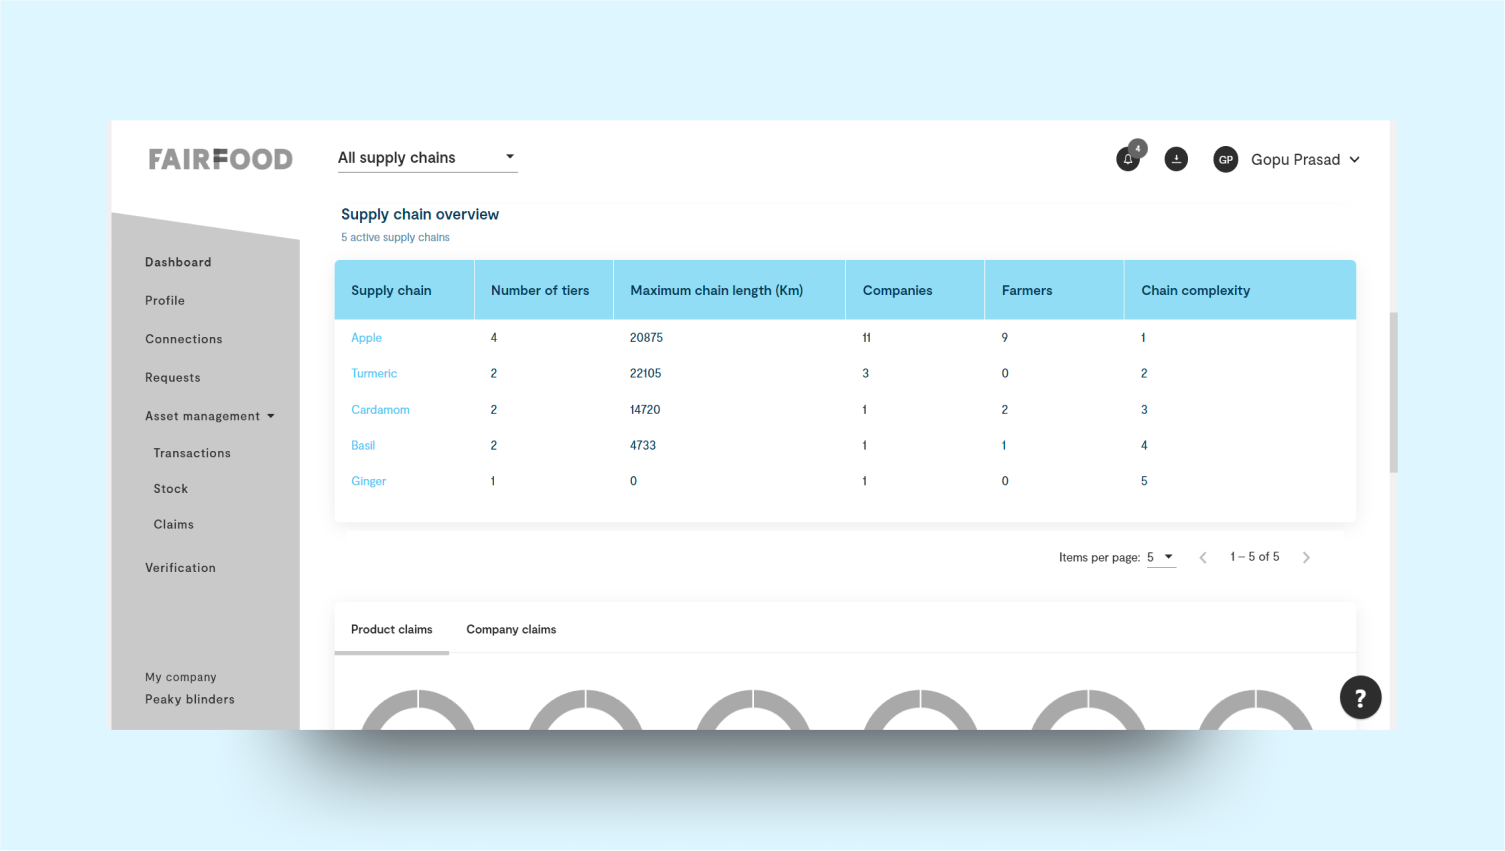
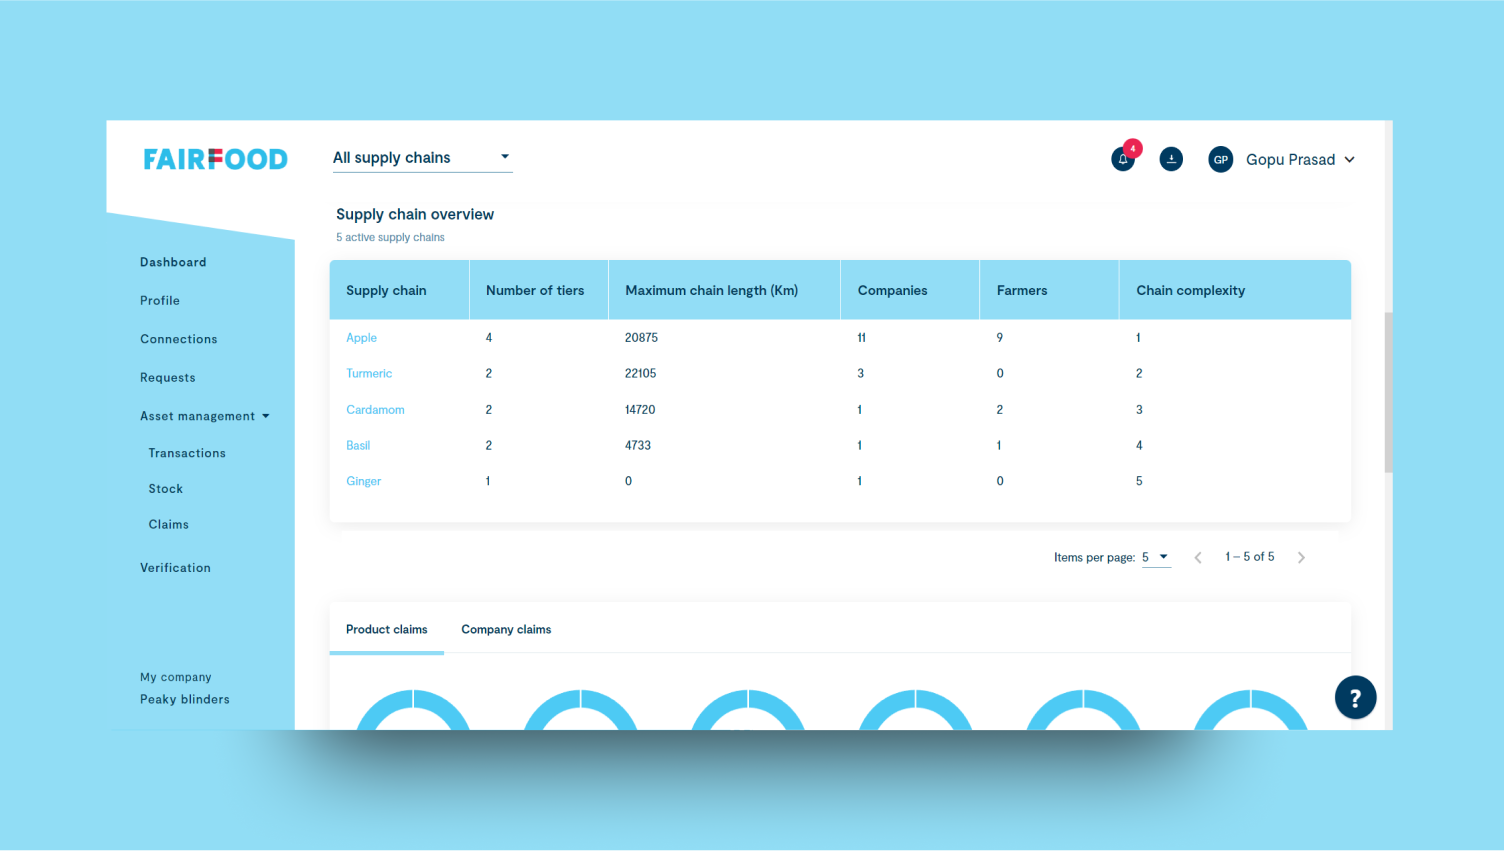
- Supply Chain Number: Identifies each unique supply chain.
- Number of Tiers: Shows how many levels or stages are in the supply chain.
- Maximum Chain Length: Displays the longest distance, in kilometers, across the supply chain.
- Companies Involved: Lists the companies participating in the supply chain.
- Farmers Connected: Shows the farmers linked to each supply chain.
- Chain Complexity: Indicates the complexity level of the supply chain, based on its structure and connections.
4
Other details
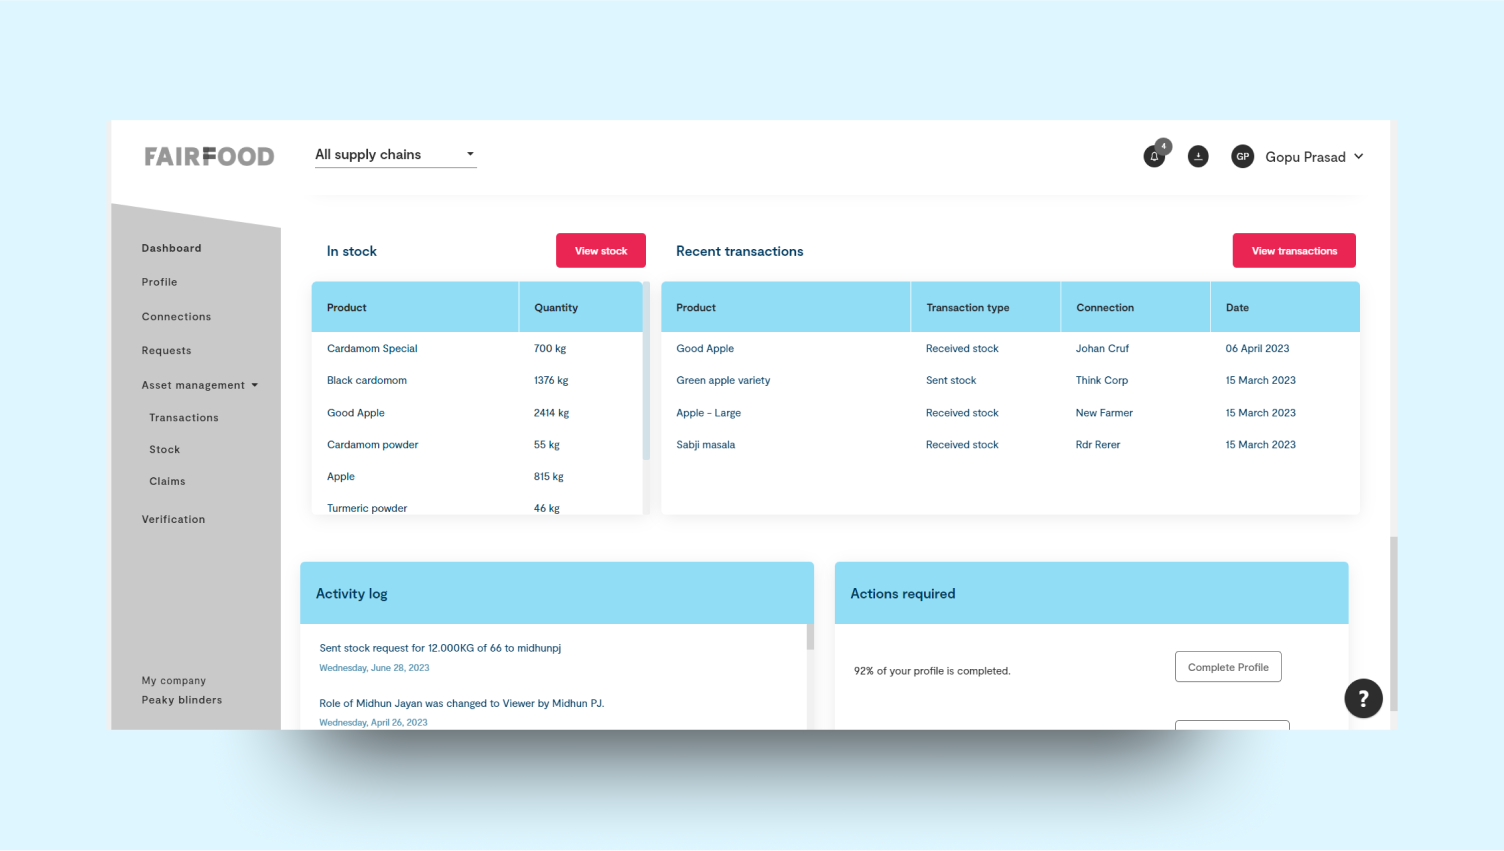
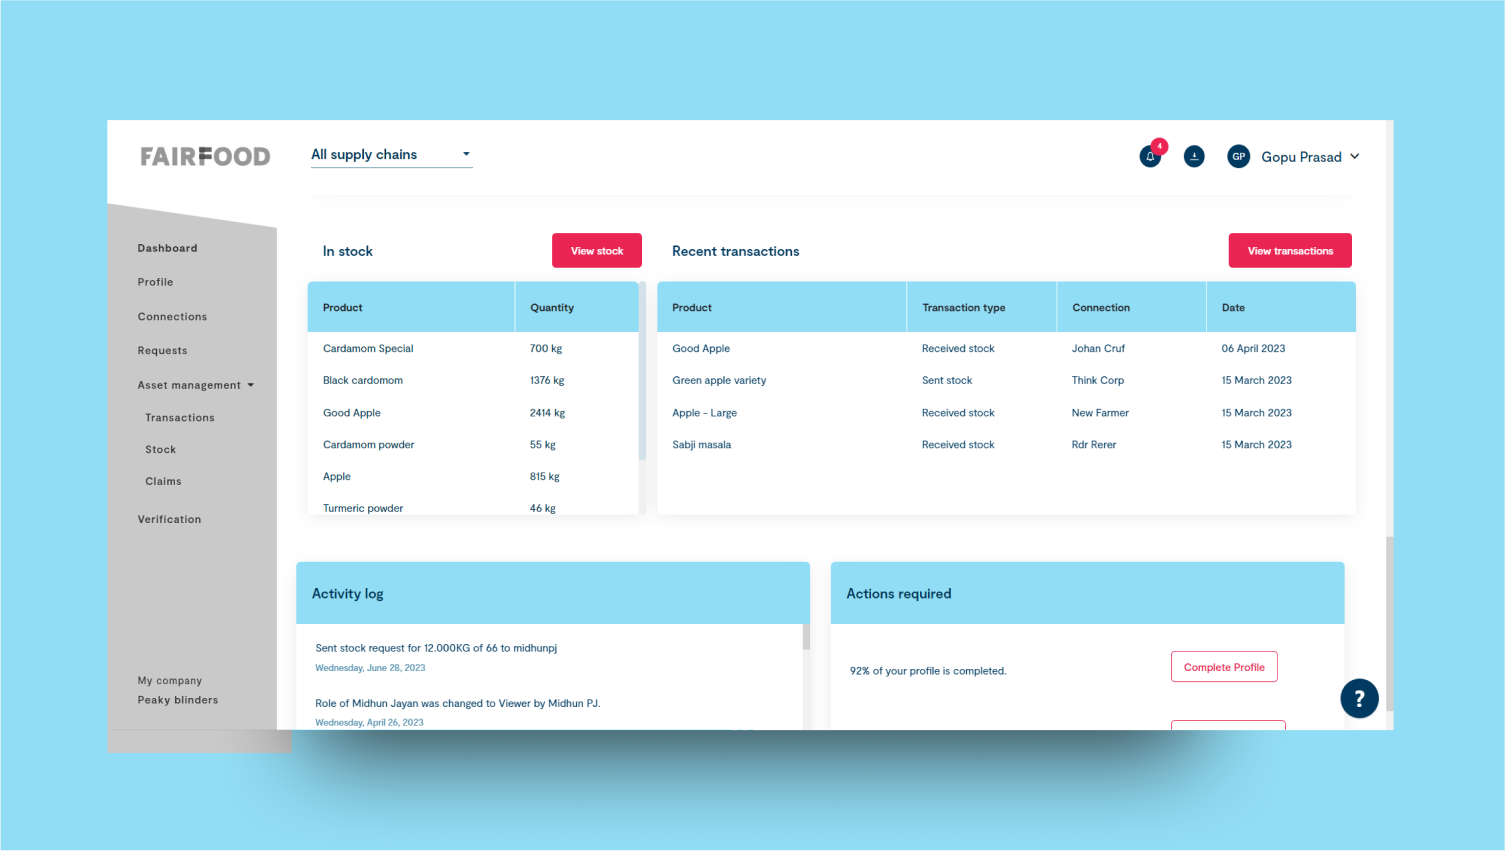
- Recent Transactions shows the latest details about what products were bought or sold, how much, and when.
- Active Logs shows a list of recent changes or updates happening in the system.
- Actions Required tells you about tasks that need to be done, like approvals or follow-ups.